Google Lighthouse is a powerful tool for improving web performance and user experience. You can use it to run automated website audits—and get insights into issues with performance, accessibility, and SEO.
![]()
In this guide, you’ll learn:
- How Google Lighthouse evaluates and scores web performance.
- How to use Lighthouse via Chrome DevTools, CLI, and Node.js library.
- Advantages and challenges of integrating Lighthouse into CI/CD workflows
- How to run concurrent Lighthouse tests with Browserless
How does Google Lighthouse help developers?
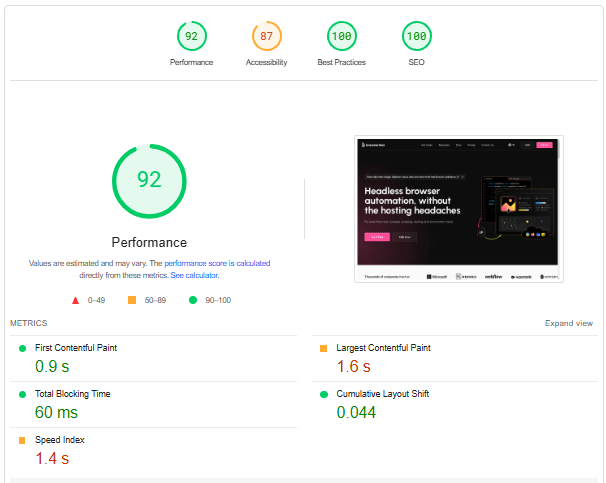
Google Lighthouse is a tool to measure a page’s performance, accessibility and SEO. It gives developers key metrics such as time to first contentful paint.
Many developers prefer Google Lighthouse because it's open-source, free, and easy to use. Plus, you can automate it to generate regular reports—reducing the need to conduct UX tests manually.
Most engineers' first experience with the tool comes through the Chrome tab, which provides mobile, desktop, and best practices scores out of 100. These scores are based on web page parameters including:
- Performance: Measures how quickly a page loads and becomes interactive, such as time to first byte
- **Accessibility: **Assesses how easily users, including those with disabilities, can navigate the site.
- Best practices: Reviews the site for common web development and security issues.
- Search engine optimization (SEO): Analyzes the site’s search engine optimization, ensuring it meets best practices for discoverability.
- Progressive Web Apps (PWA): Tests the site to see if it meets the technical requirements for optimal UX.
There are three ways in which you can access and use Google Lighthouse:
Running manual tests with DevTools or PageSpeed
There are two ways to manually run individual Lighthouse tests. You can visit pagespeed.web.dev and enter the URL to inspect, which will output a performance report:
You can also run a report on your device using Chrome’s DevTools:
- Right-click on the web page and select "Inspect."
- In the DevTools menu, choose Lighthouse.
- Select categories to audit (parameters) and devices.
- Generate report.
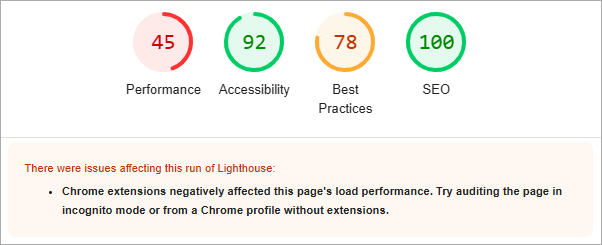
It's excellent for on-the-fly audits of different web pages as you get immediate feedback that you can implement. But, it has the downside that tests can be affected by things like Chrome extensions you have installed.
Command Line Interface (CLI)
If you want to automate this process and run scriptable audits, choose the CLI method. This can be useful for cases where you’re running these workflows as part of your continuous integration setup.
Here’s how you can generate the report:
- Open your terminal and install Lighthouse via npm
- Use this command to run it on a
URL: lighthouse https://yourwebsite.com - Check the HTML report to see the results.
Node.js Library
Use this method if you need programmatic access to integrate it into your CI/CD pipeline. It lets you run custom audits based on specific configurations. Here's how you can do that:
- Add Lighthouse to your project by installing it via npm.
- Create a JavaScript file to run Lighthouse programmatically.
- Execute the script using Node.js.
Challenges with scaling Lighthouse testing
Let’s say you have a set of key pages that you want to test, each with a few variations of device and bandwidth simulations. You quickly end up wanting to run dozens of Lighthouse tests.
Unfortunately, scaling these tests are hard for reasons outlined in this GitHub comment:
Let’s discuss these in more detail.
- **No concurrency support: **Lighthouse only lets you run one audit per Node.js process. If you’re auditing multiple pages and configurations, you’ll have to run these audits sequentially or manage multiple processes (separate machines/threads or complex parent/child process architecture).
- **Resource intensive: **These audits can be quite resource-intensive—especially when running multiple audits in parallel. The Chrome instances end up using too much memory which skews the results.
- **Slow execution times: **Speed is critical for CI/CD pipelines. But running too many configurations at once or detailed analyses significantly slows down the process. This happens because the page loads multiple times based on the number of "budgets" or device configurations being tested.
- **Complex setup for automation: **Even though you get great control over testing parameters, that comes with challenges. Each configuration adds more complexity and dependencies. Plus, you'll have to continuously maintain and update the configurations to make sure it's compatible and accurate.
Using Browserless’s /performance API for parallel Lighthouse tests
Instead of spending time wrangling Lighthouse to fit your needs, use our /performance API.
Browserless hosts a large pool of managed browsers. They’re used for many things such as running Puppeteer or Playwright scripts, but we also use them for running Lighthouse tests through the API.
Using the API lets you run parallel Lighthouse tests, as we take care of the details such as:
- **Resource management: **Browserless takes care of all the hardware utilization, including GPU acceleration, which can speed up audits and provide realistic results.
- **Parallel processing: **We manage all the node.js packages and Chrome instances, so you can manage multiple Lighthouse audits in parallel—making it a scalable option for larger projects.
- **Simplifying CI/CD integration: **Instead of setting up and managing your audits, a simple integration lets you focus on interpreting the results.
- **Increasing reliability: **You get extensive support and reliability, which is great for conducting regular automated performance testing.
If you're using a hosted plan, you can send a POST request to https://production-sfo.browserless.io/performance with a JSON payload containing the URL.
Here’s an example:
curl -X POST \
  https://production-sfo.browserless.io/performance?token=MY_API_TOKEN \
  -H 'Cache-Control: no-cache' \
  -H 'Content-Type: application/json' \
  -d '
{
  "url": "https://example.com/"
}'
You can find more information in our API documentation.
Let’s say you want to run an audit for the URL “www.amazon.ca.”
- Create a JSON payload like this:
{
  "url": "https://www.amazon.ca",
  "options": {
    "output": "html"
  }
}
- Send a POST request to https://production-sfo.browserless.io/performance.
- The /performance API will run the request and gather all metrics by default:
// ...
  "audits": {
    "is-on-https": {
      "title": "Uses HTTPS",
      "score": 1
      // ...
    },
    "viewport": {
      "title": "Has a `` tag with `width` or `initial-scale`",
      "score": 1
      // ...
    },
    "first-contentful-paint": {
      "score": 1,
      "displayValue": "0.8 s"
      // ...
    }
    // ...
  }
Each test will give a score from 0 to 1.
An output of all the metrics results in a big JSON response, typically around 350kb to 800kb. We would recommend picking specific categories using the config property. You can choose from accessibility, best practices, performance, pwa, and seo.
Use our pool of browsers to run Lighthouse audits at scale
Google Lighthouse is powerful and offers an excellent option for assessing performance regularly. But running it can be a pain once you start scaling automated audits.
Issues like resource intensiveness, slow execution times, and no support for concurrencies make it a hassle rather to use for multiple pages. Why not run it on a pool of managed browsers instead?
That's where Browserless's /performance API comes in. The API lets you focus on analyzing performance instead of dealing with Lighthouse’s complexities. In return, you get a simple integration and improved reliability, supporting your CI/CD workflows.
Take Browserless for a test drive using the 7-day free trial.